Introduction
In this first blog post, my goal is to explore two central questions:
1) How competitive are presidential elections in the United States?
2) Which states vote blue/red and how consistently?
At the end of this blog post, I will also be sharing my first electoral map prediction for the 2024 presidential election. Each week from here on out, I will be updating this model to consider additional predictors like real-time polling averages, historical trends in the electoral college, demographic changes in the United States, and economic conditions, etc.
The code used to produce these visualizations is publicly available in my github repository and draws heavily from the section notes and sample code provided by the Gov 1347 Head Teaching Fellow, Matthew Dardet.
Analysis
To begin to answer the first question of how competitive presidential election are in the United States, I used popular vote data from 1948-2020 to construct a line plot of the two-party vote share of each presidential election within that time span. I considered only election years after WWII as these elections are the most likely to be substantively similar to the one that will take place in November 2024. Though an imperfect starting place, the end of WWII offers a “cultural reset” of sorts that distinguishes the modern era from a less technologically advanced and socially interconnected past.
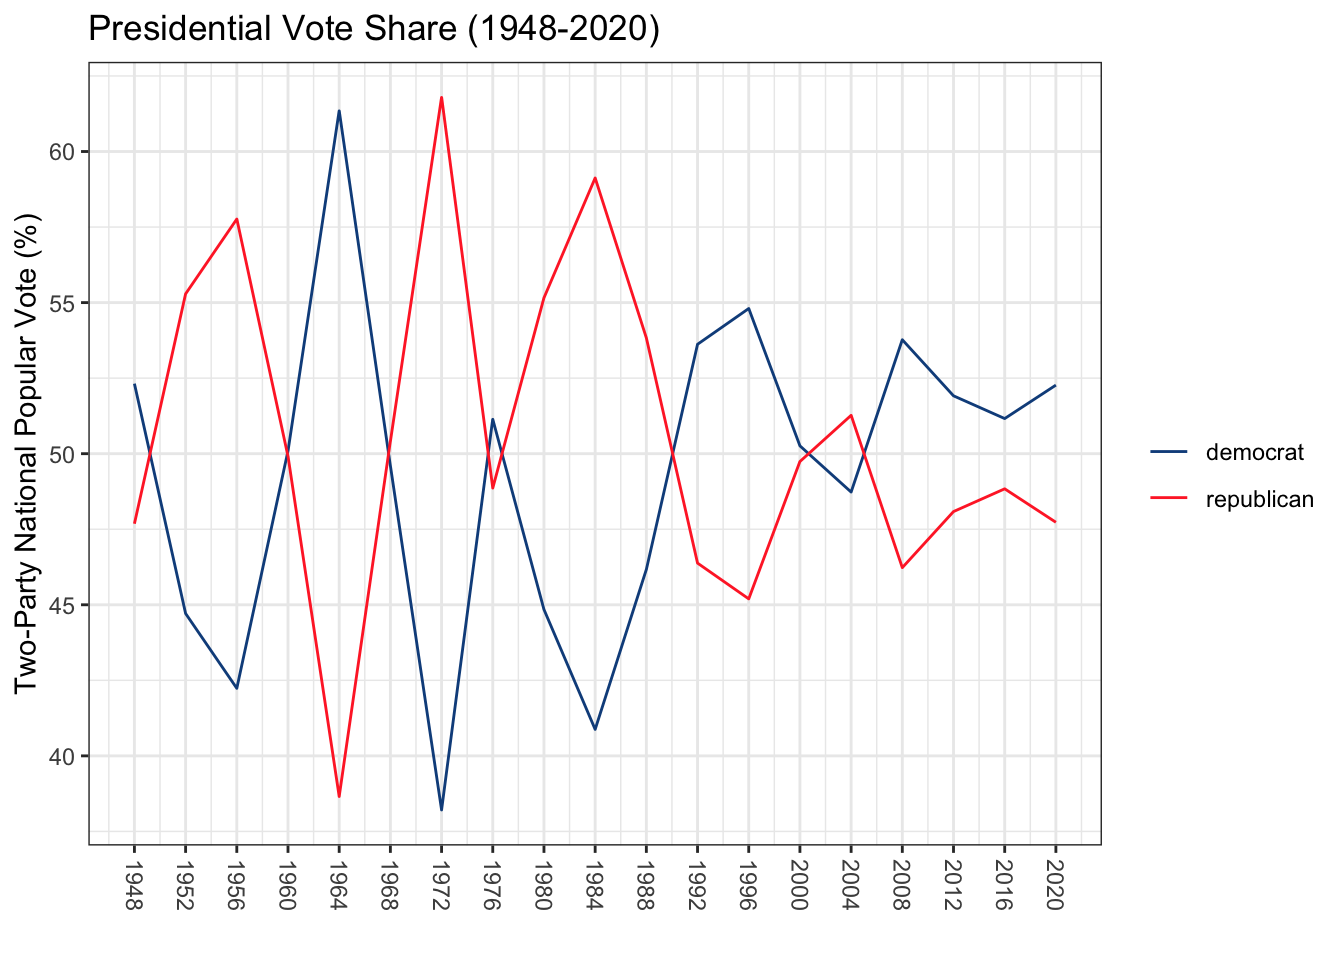
From this line plot, we can see that presidential elections have become increasingly competitive in recent decades, perhaps reflecting increased polarization in the country between the two major parties: Republican and Democratic. With the exception of 1948 and 1976, presidential elections after WWII and before 1992 did not produce national, two-party popular vote shares that were less than 10 percentage points apart. In the eight presidential elections following and including 1992, the two-party popular vote share has not exceeded 10 percentage points in difference, signalling that presidential elections in the United States have become very competitive in the last few decades.
To answer the second question of which states vote blue/red and how consistently, I will produce a panel data set of the party of the candidate that took the majority of the popular vote in each state for each year between 1992 and 2020 and then use this panel data set to produce a grid of electoral maps for each year color-coded by the winning party for each state. I choose to begin with 1992 as this is when elections began to consistently tighten in the United States and I am chiefly interested in how states have voted within recent memory.
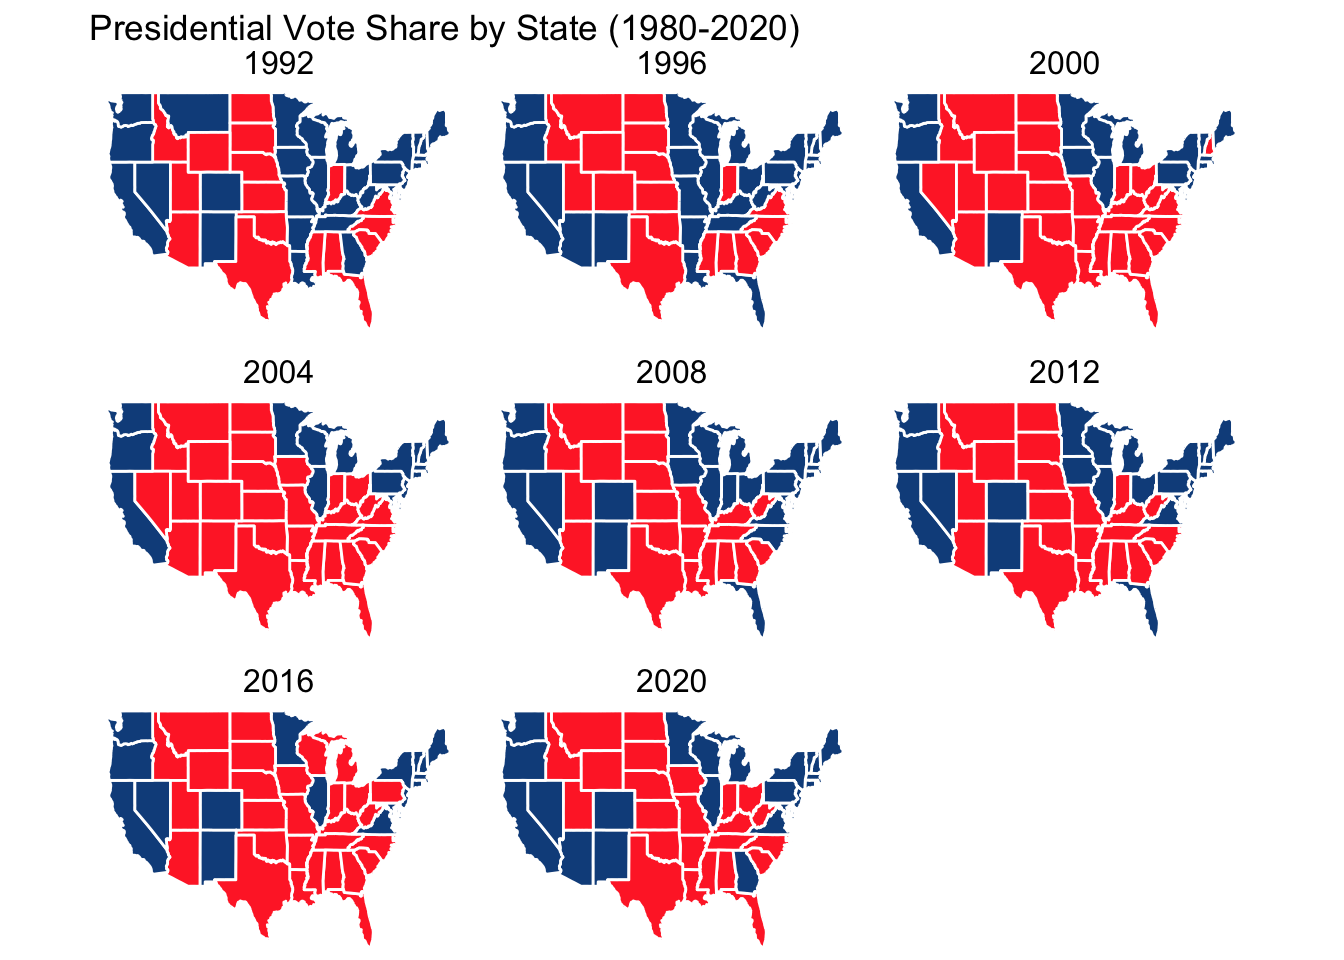
These graphs seem to reveal certain regional trends in voting behavior. The Northeast, West Coast, and Great Lakes states seem to pretty consistently vote for Democrats, whereas the South, Mountain West, and Plains states tend to vote for Republicans. Other regions, like the Midwest appear to be more variable. Just from visual inspection, there appear to certain states like Arizona, Michigan, and Pennsylvania, among others, that have voted for different parties in just the past two election cycles.
Given that the ultimate goal of this blog is to predict the 2024 election cycle, a match up between Harris and Trump, I am interested in seeing the two-party margin of victory in each state in 2016 and 2020 as Trump was a candidate in both of these elections. This will give me a sense of which states are most competitive.
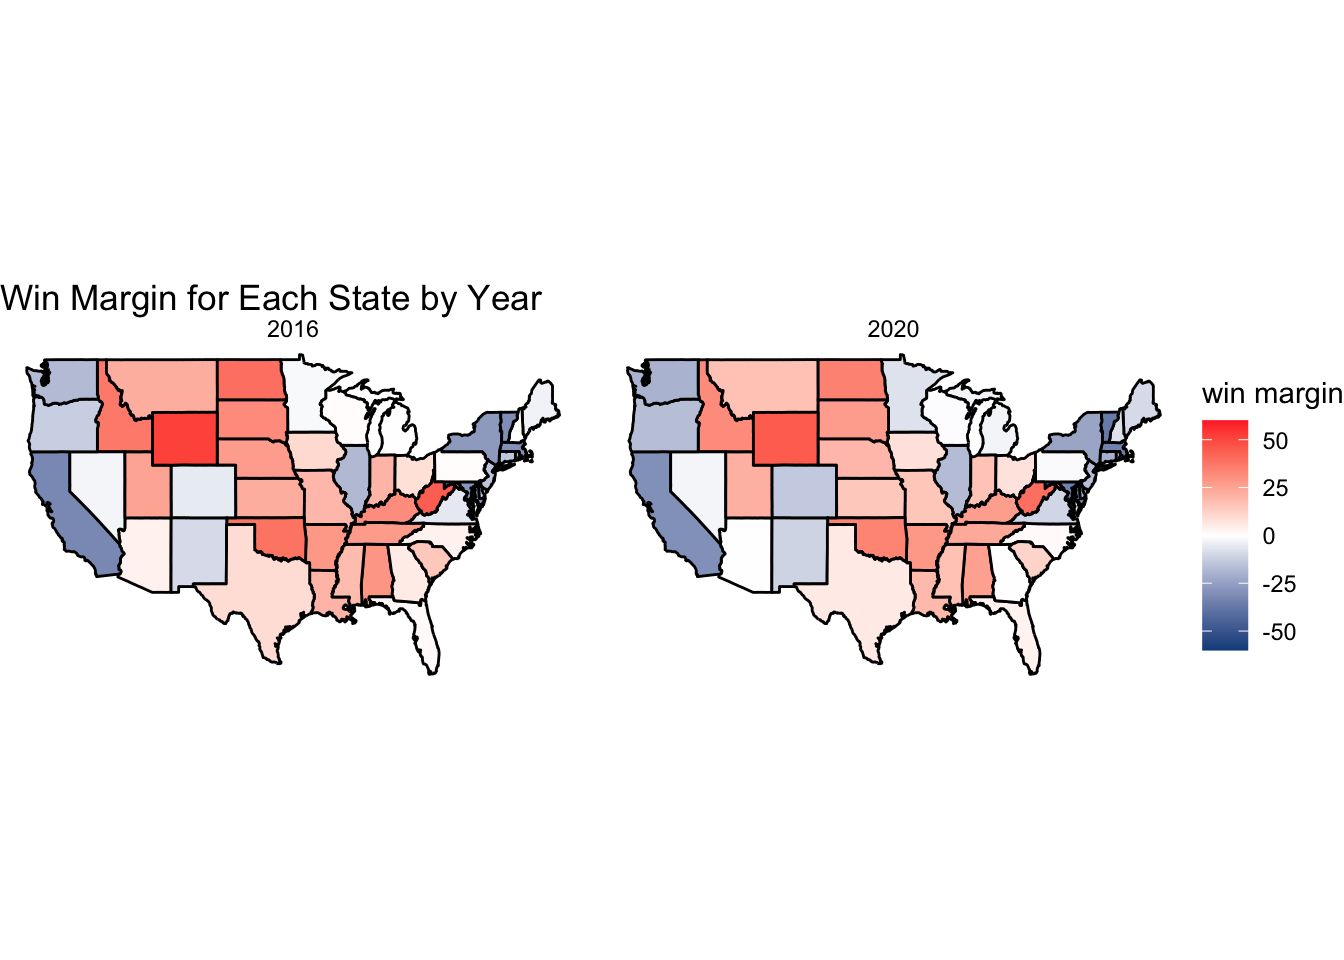
From these two graphs, I can see that, in the two most recent election cycles, states like Arizona, Pennsylvania, Georgia, and North Carolina have had exceptionally narrow win margins and are likely to serve as swing states in the 2024 election.
As a first pass at constructing a model to predict the 2024 election, I will weight the vote share of the 2016 and 2020 elections in each state to produce an estimate for this year’s national presidential election using the following formula:
$$ Y_{2024_i} = \frac{3}{4} * Y_{2020_i} + \frac{1}{4}*Y_{2016_i}$$I chose to weight 2020 three times as much as 2016 as I believe 2020 is three times as predictive of 2024 as 2016 since it is both more recent and is a matchup between members of the same president/vice president tickets. The following map with the projected win margin for each state is produced. Below is the forecasted electoral college total. This was produced by merging a year-by-year breakdown of each state’s total electoral votes with the two-party popular vote data frame for each state and year.
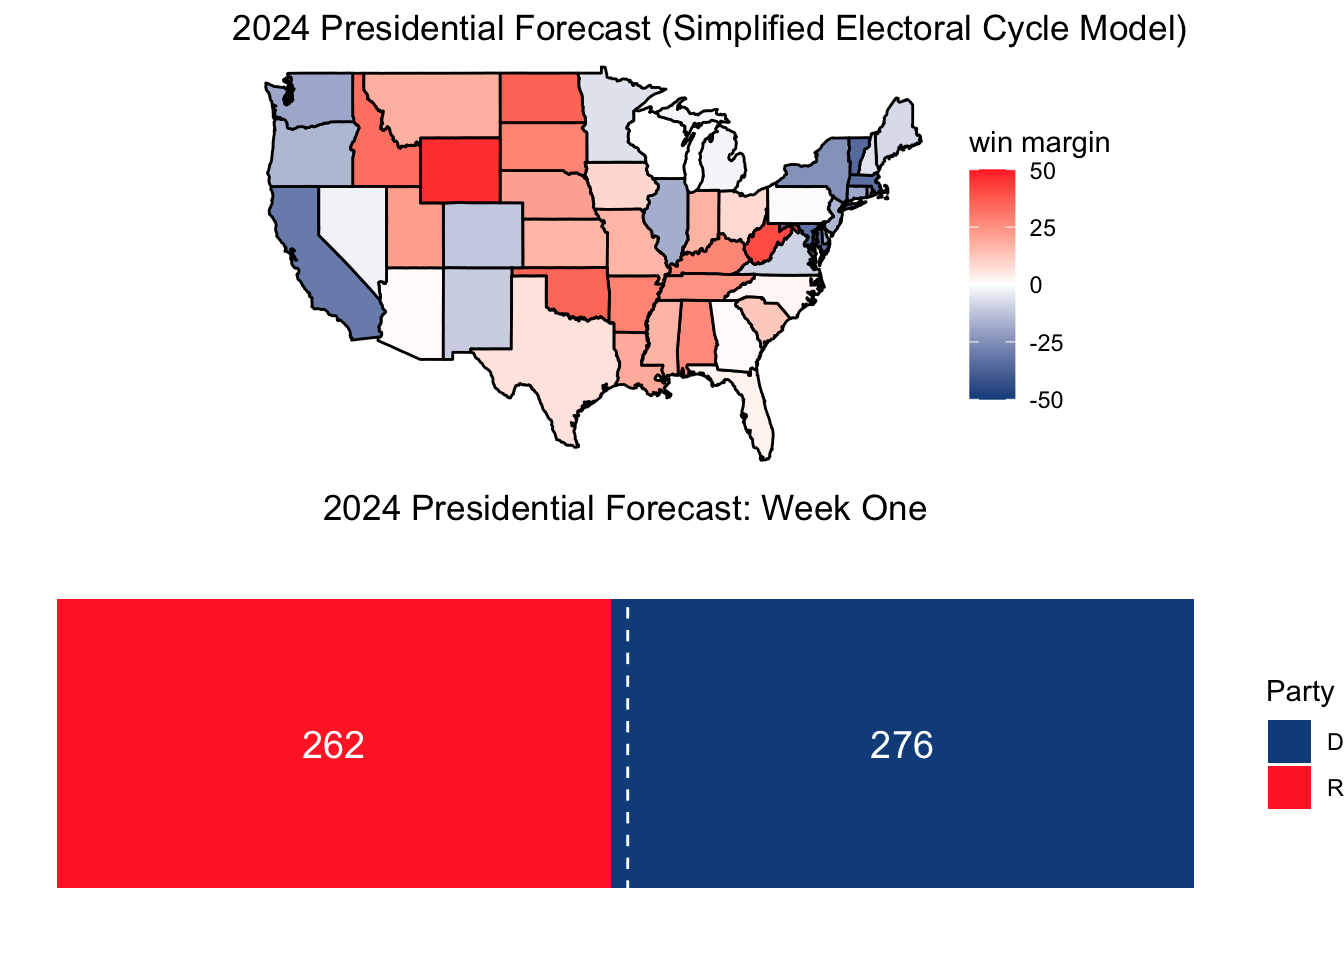
As we can see, my first model, a simplified electoral cycle model that relies exclusively on the two-party popular vote shares from the 2016 and 2020 election, predict a Harris win with 276 electoral votes compared to Trump’s 262.
I would like to further explore the electoral college by investigating who actually won the elections in our data set and the potential bias the electoral college could give either party. I will do this by comparing the nationwide electoral college results with the nationwide two-party popular vote totals for both the 2016 and 2020 elections. This data was published by the Associated Press and shared by The New York Times.
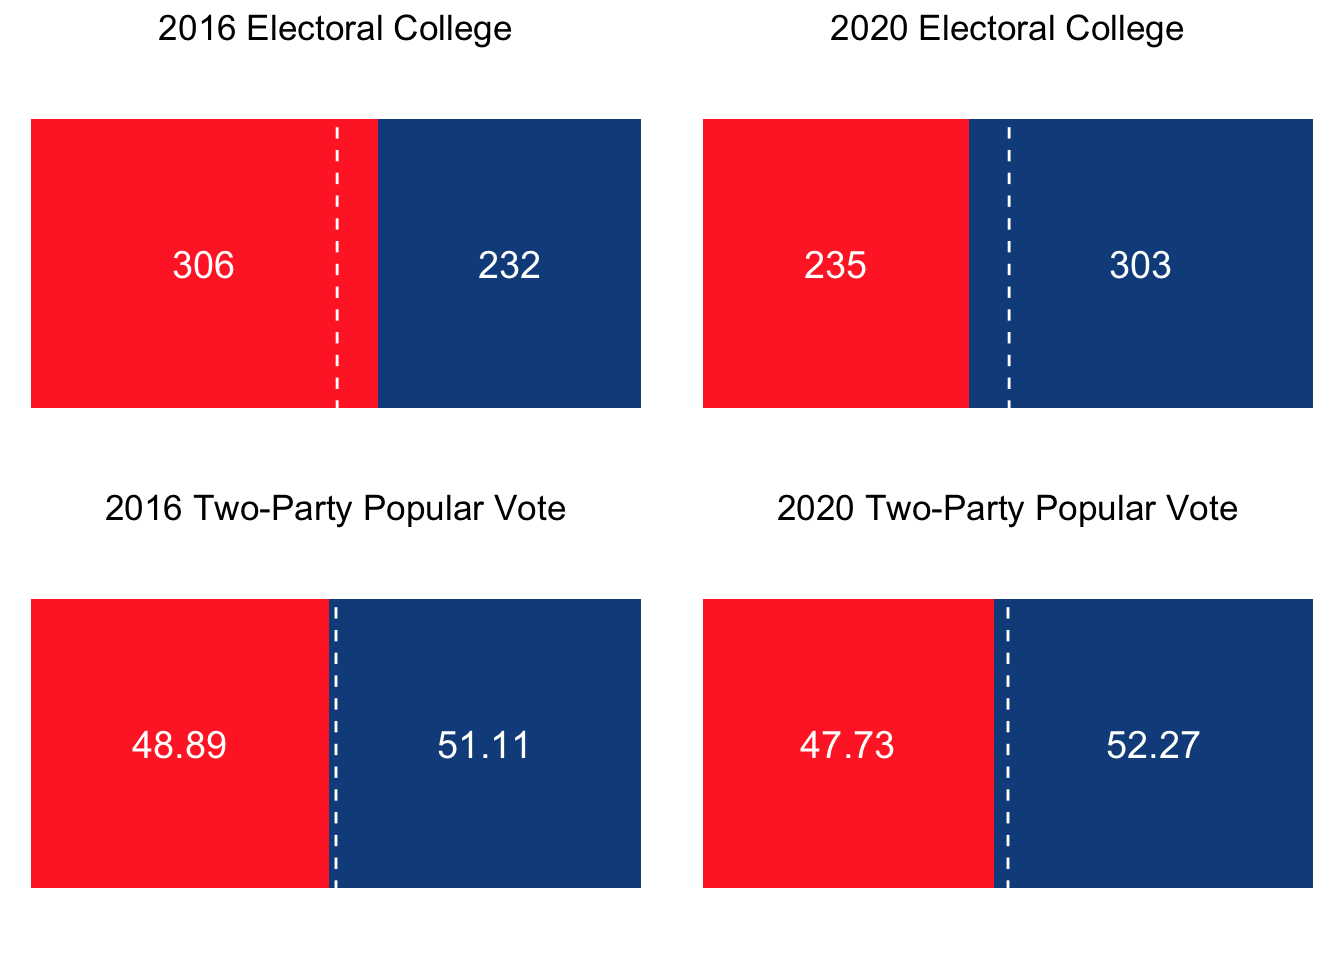
These electoral college totals do not consider unfaithful electors.
In displaying the popular vote and electoral college results side-by-side, it is clear that, in both 2016 and 2020, the Republican party lost the two-party national popular vote. It, however, in 2016, still managed to solidly win the electoral college. This could reflect a bias in the electoral college in favor of Republicans, perhaps because, despite there being more Democrats, they tend to cluster in urban cities and populous states like California and New York. For example, a 65-35 win for a Democratic candidate in California does not do more for the Democratic candidate than a 51-49 win would have, despite the potential millions in additional votes for the Democratic candidate that the former outcome would have provided.
J. Miles Coleman and Kyle Kondik in their Center for Politics article, “A Brief History of Electoral College Bias,” explains how, though the electoral college has favored Republicans in recent years, it could very well exhibit a slight Democratic bias if states continue to shift demgraphically and electorally. For example, if “Arizona and Georgia” continue to shift leftward while “Michigan and Nevada simply maintain the way they voted in 2020,” the Electoral College will soon exhibit a Democratic lean. This suggests that the electoral college is not systemically biased toward either party, necessarily, but vacillates in how well it matches the national popular vote largely based on whether people of certain political leanings tend to cluster or not.
Citations:
“2016 Presidential Election Results.” The New York Times, The New York Times, www.nytimes.com/elections/2016/results/president. Accessed 9 Sept. 2024.
Coleman , J Miles, and Kyle Kondik. “A Brief History of Electoral College Bias.” Sabato’s Crystal Ball, 6 July 2023, centerforpolitics.org/crystalball/a-brief-history-of-electoral-college-bias/.
“Presidential Election Results: Biden Wins.” The New York Times, The New York Times, 3 Nov. 2020, www.nytimes.com/interactive/2020/11/03/us/elections/results-president.html.
Data Sources:
Data are from the US presidential election popular vote results from 1948-2020. National popular vote percentage totals are also drawn from The New York Times for 2016 and 2020.