Introduction
In this second blog post, I want to explore
1) whether it is possible to predict election outcomes using only the state of the economy
2) and, if so, how well
The code used to produce these visualizations is publicly available in my github repository and draws heavily from the section notes and sample code provided by the Gov 1347 Head Teaching Fellow, Matthew Dardet.
Analysis
To begin to answer the first question of whether it is possible to predict election outcomes using only the state of the economy, I will merge Federal Reserve Economic Data from the St. Louis Fed with other economic data from the Bureau of Economic Analysis. I will then perform various tests to explore the relationship between the state of the economy and the national popular vote share between 1948 and 2020.
The first visualization that I will prepare is a scatterplot of the Q2 GDP growth in the year of the presidential election versus the national two-party popular vote share won by the incumbent.
I zeroed in on Q2 GDP growth in large part because of the findings of Professors Christopher H. Achen and Larry M. Bartels from Princeton and Vanderbilt respectively in their 2016 book “Democracy for Realists: Why Elections Do Not Produce Responsive Government”.
Achen and Bartels make a strong case that voters are not fully retrospective in their decision-making; rather than equally weighting the performance of the incumbent president’s party in the past four years, voters tend to base their ballot more explicitly off of what the voter has seen recently. The two authors demonstrate this by evidencing how the percent change in real disposable income in quarter 2 of the presidential election year, the most recent quarter leading up to the election (Q14 to Q15 of the 4-year cycle) accounts for a whopping 81% of the variance in the tenure-adjusted popular vote margin of the incumbent party for elections between 1952 and 2012. Longer-term RDI change between Q3 and Q15, however, accounts for only 54% of the variance.
Though I am not accounting for tenure advantage, and I am looking at two-party vote share rather than vote margin, I still expect Q2 GDP growth in the presidential election year (Q14-Q15) to be a useful predictor to investigate.
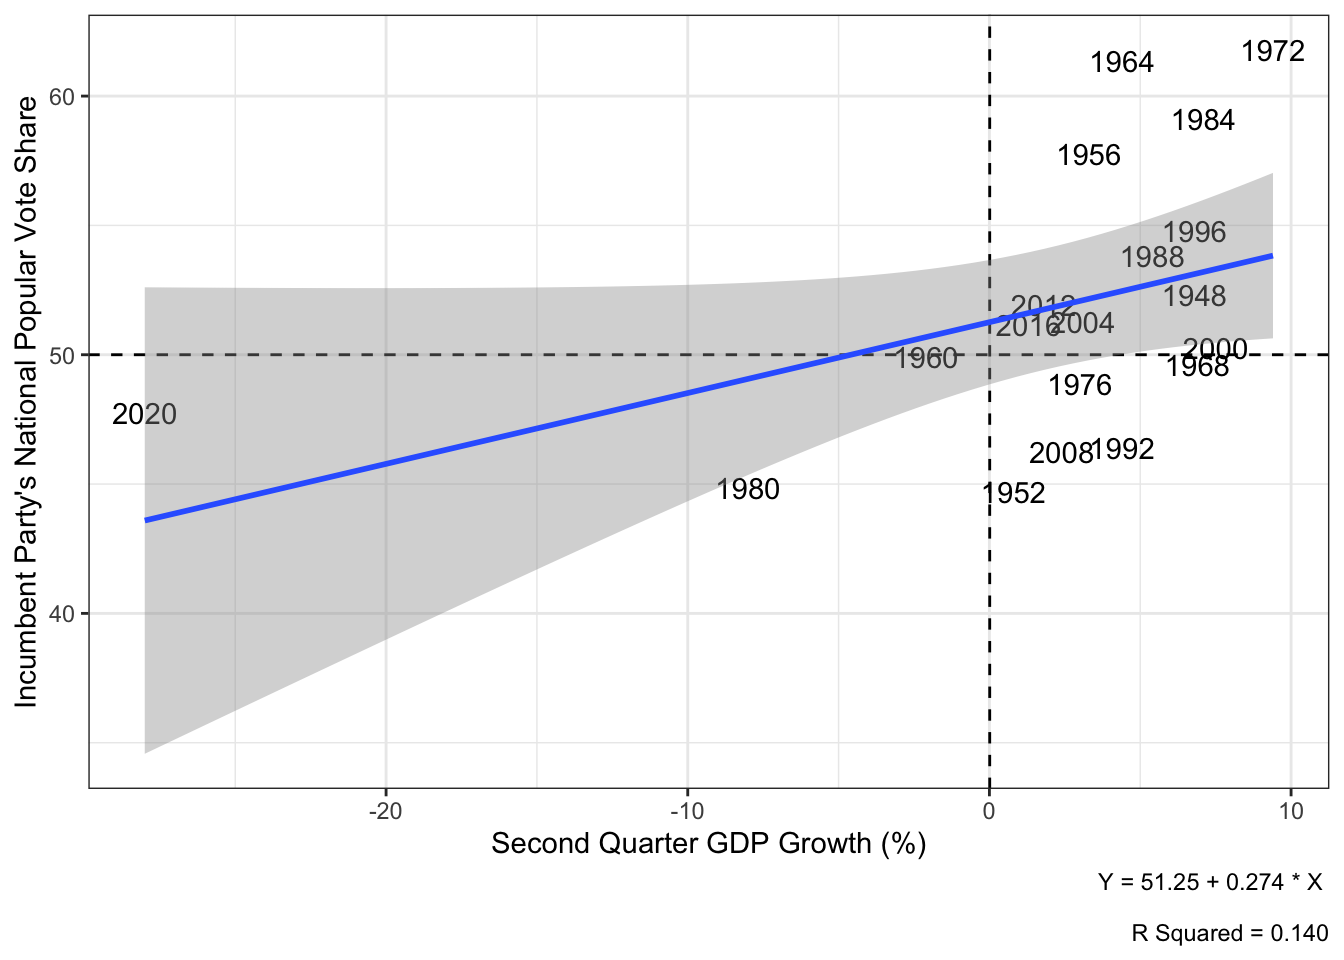
Noting how 2020 appears to be a significant outlier that could potentially be biasing the line of best fit, I will perform this same analysis once more after having removed 2020. Since the primary objective of this blog is to predict the 2024 presidential election, I believe it is well-warranted to exclude economic data from Q2 of 2020, as this massive decline in GDP was attributable to the COVID-19 pandemic and less immediately to the governance of the Trump administration. Given how far outside of the pre-existing observation set 2020 was in terms of the magnitude of its economic decline, too, it is unlikely to be informative of the effect modest economic growth and decline has in more typical election years like the one we are currently experiencing in 2024.
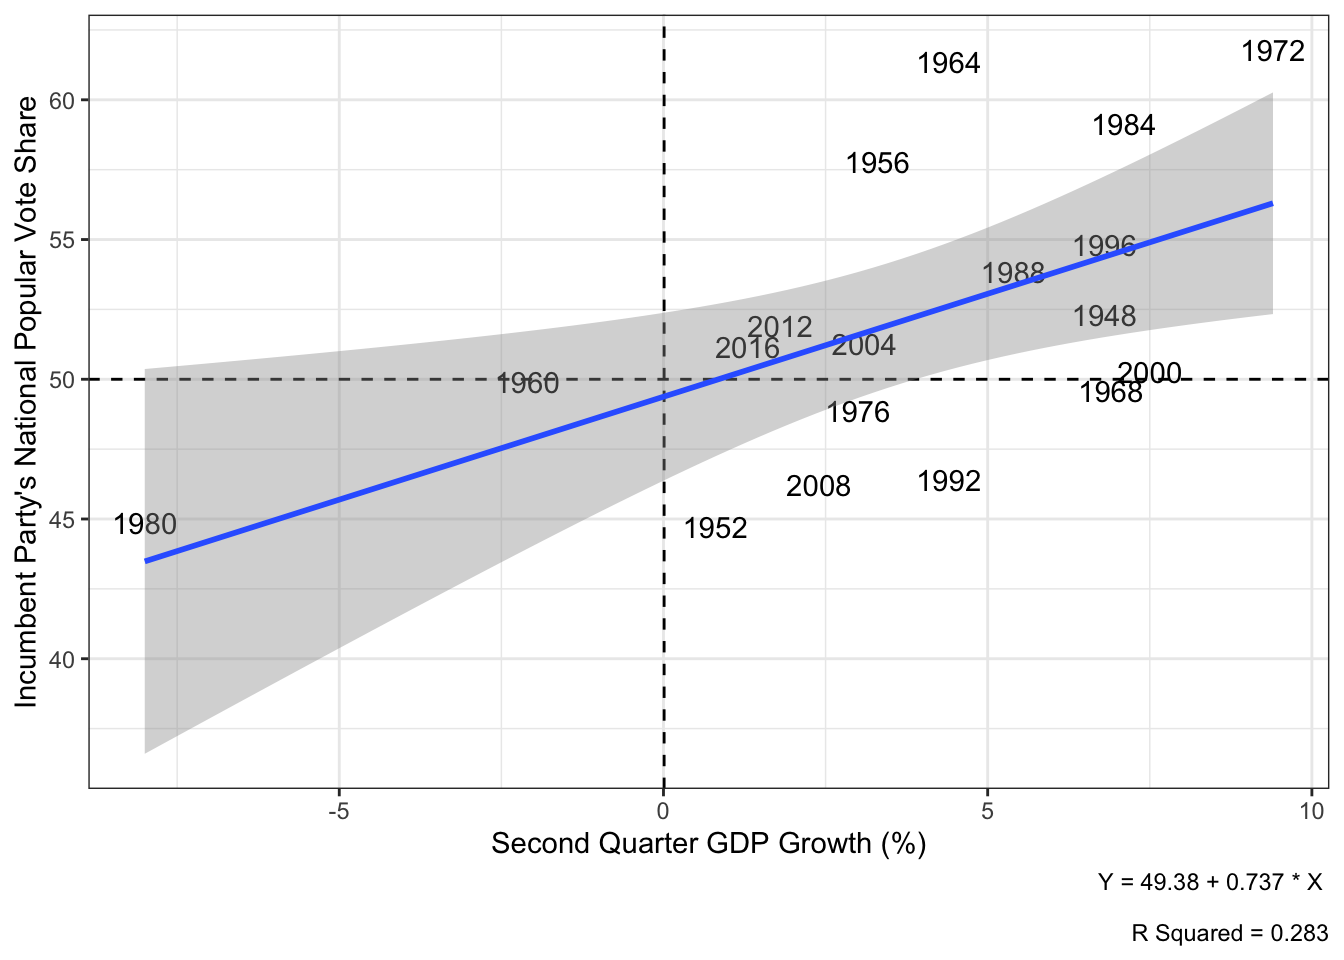
Plotting the scatterplot once more, this time without including 2020, we observe that the R squared term jumps from 0.14 to 0.283. In other words, once we remove the outlier of 2020 and regress the incumbent party’s national two-party popular vote share on second quarter GDP growth, we observe that second quarter GDP Growth now accounts for 28.3% of the variance in the popular vote share versus the 14.0% of the popular vote share that it did beforehand.
Using this model that estimates the incumbent party’s two-party national vote share based exclusively off of the Q2 GDP growth, we predict that the Democratic party will win 51.58% of the national popular vote, but with a 95% prediction interval of between 41.86% and 61.31%.
This prediction could be valid, or it could be based off of an inaccurate model. This gets into this blog post’s second question of how well economic data can predict elections. I will prepare a number of different potential models that use a variety of independent variables and economic covariates, and we will make a prediction using the best one.
Best, however, can be measured many ways. In data science, we have several tools at our disposal to evaluate models. To mitigate the risk of over-fitting, we can perform cross-validation where we randomly leave a fraction of the election years out of the data to be the test data, prepare a model using the remaining training data, and then calculate the mean out of sample error on the test years that we left out. We can do this over and over again. One constraint of presidential election data, however, is that there are relatively few elections from which we can evalaute the accuracy of our models, so model evaluation has its limitations.
This is preferable to simply preparing many models and then choosing the one that has the lowest mean squared error or the highest R-squared value on the entire data set as these would very easily lead to overfitting.
Evaluation
I will now prepare multiple predictive models using various combinations of national economic variables as predictors (1948-2016 election years). These models will be multiple linear regression OLS models, and I will evaluate them using cross-validation with 1000 simulations where 50% of the years are training data and 50% are test data.
The three predictors I will consider are
RDPI (real disposable personal income) growth rate in quarter 2
GDP growth rate in quarter 2
unemployment rate in quarter 2
The seven model combinations are
A) Predictor 1
B) Predictor 2
C) Predictor 3
D) Predictors 1 and 2
E) Predictors 1 and 3
F) Predictors 2 and 3
G) Predictors 1, 2, and 3
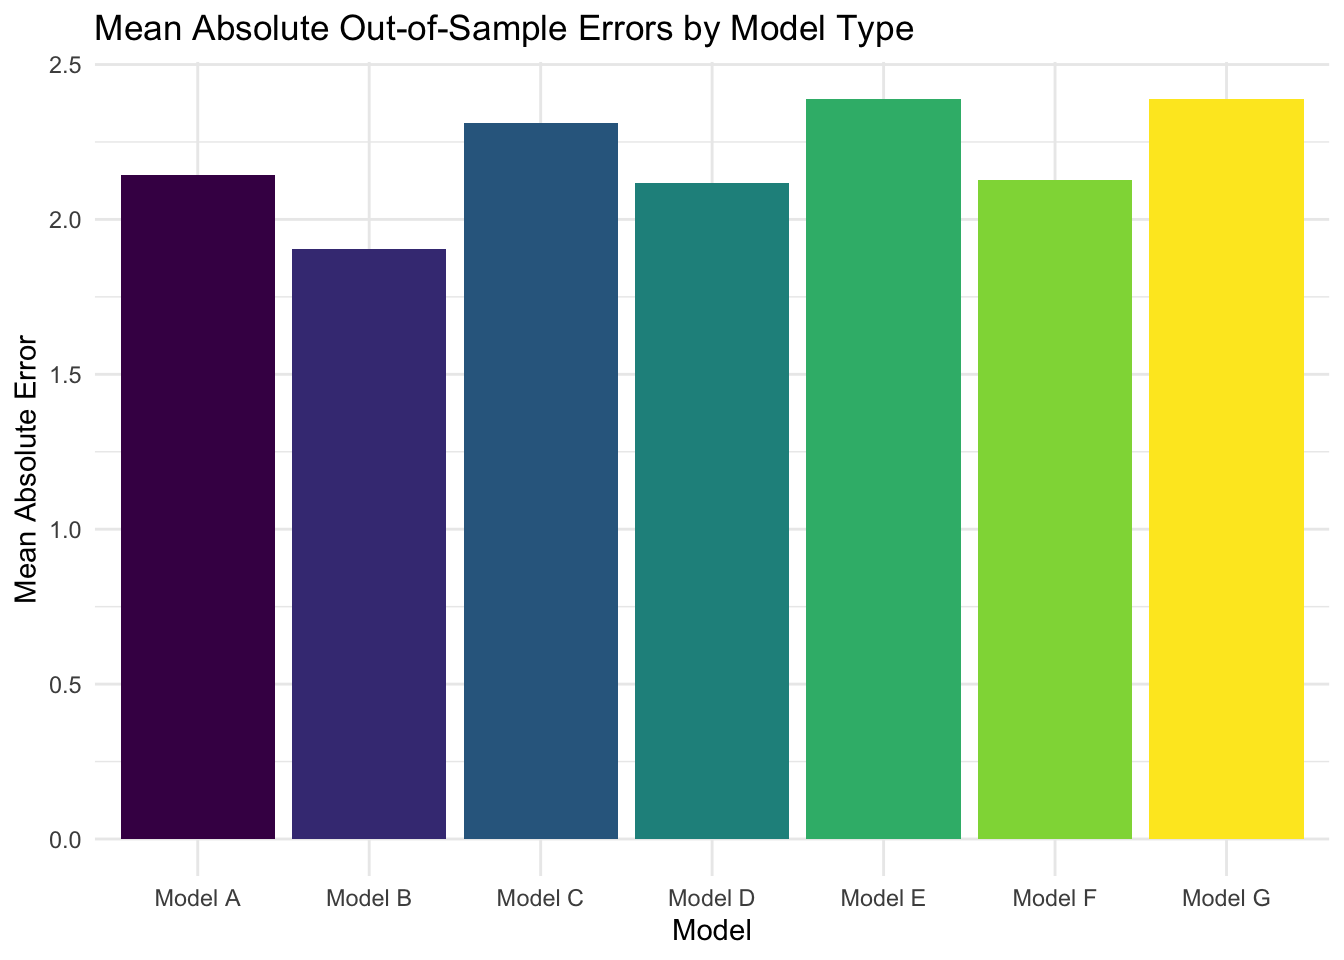
As is visible in the bar graph, model B had the lowest mean absolute out-of-sample error with 1.905321 percentage points of error. This model looked exclusively at the GDP growth rate in quarter 2 to predict the incumbent’s two-party national popular vote share, meaning this covariate was most predictive of the two-party popular vote share. It is possible these three covariates were all fairly collinear, so predicting using combinations of the covariates didn’t offer much aside from additional complexity with which to overfit.
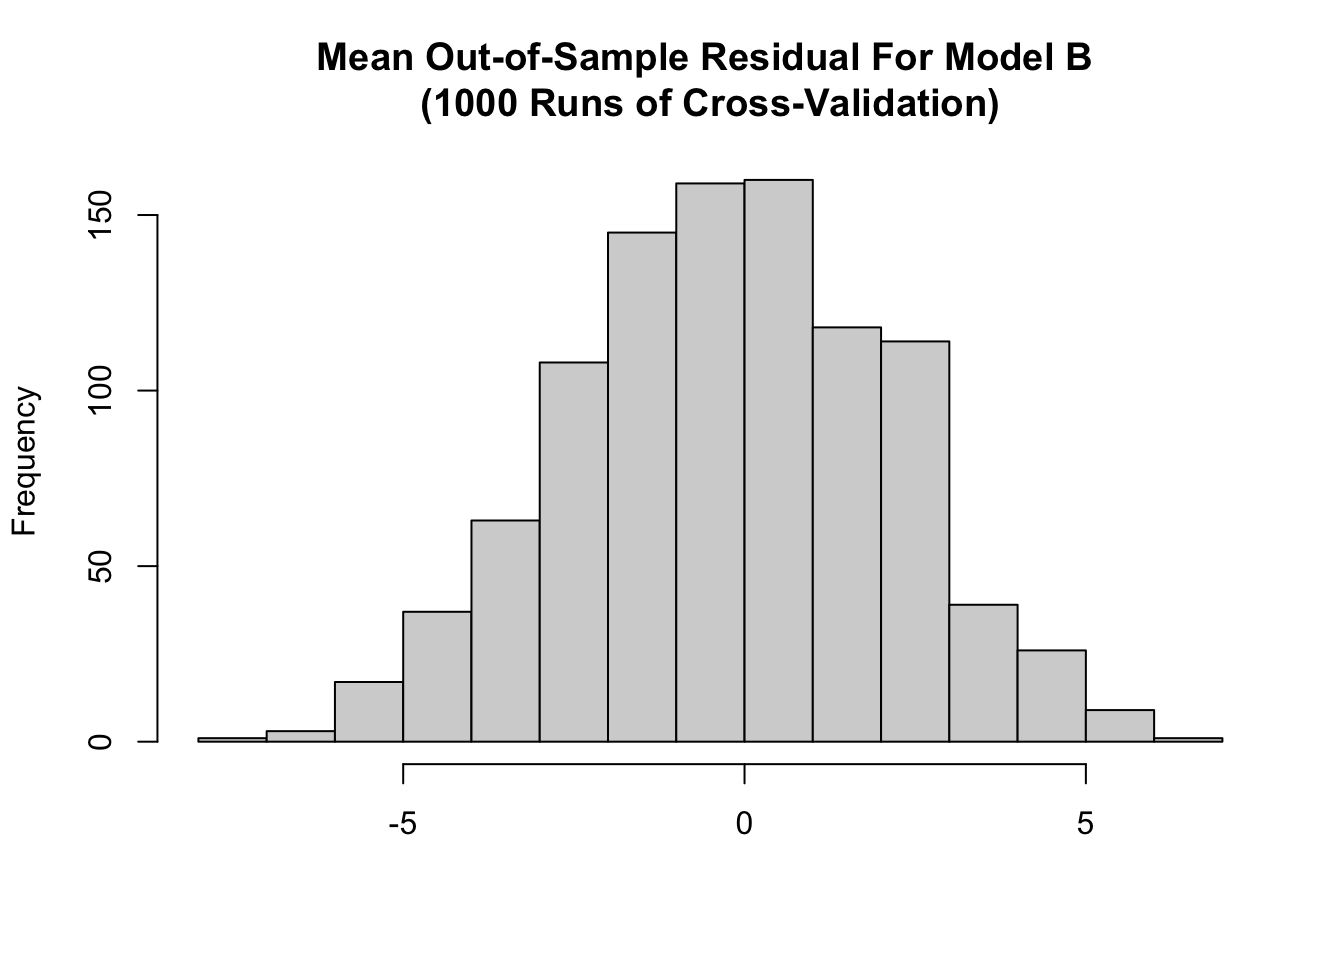
Visible below is the distribution of out-of-sample error across the 1000 cross-validation simulations. The distribution appears fairly unbiased.
When we plot the predicted popular vote shares for 2024 from each model, we get the following graph.
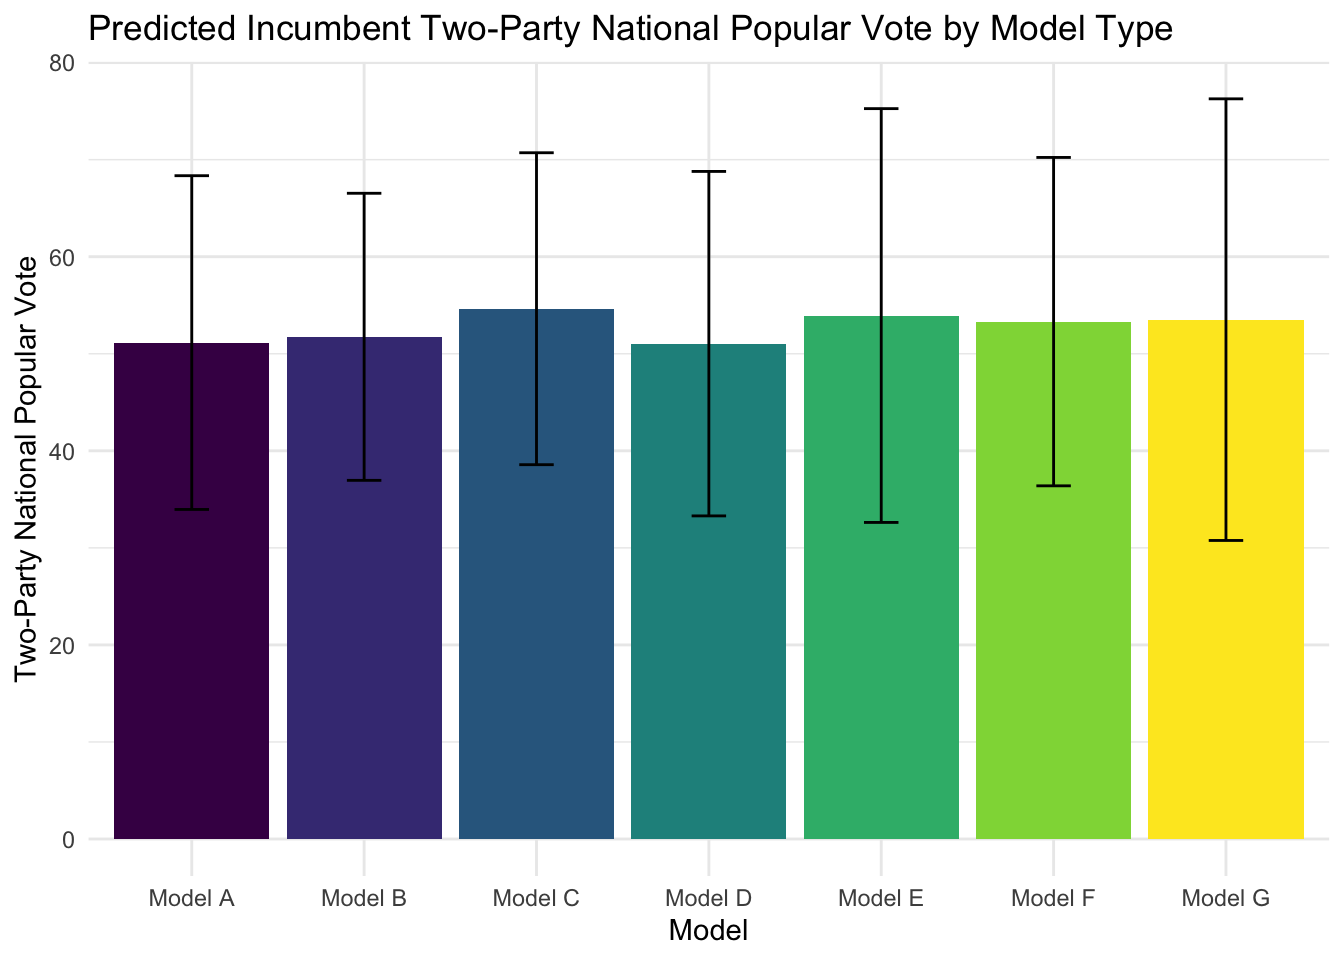
All of these models, however, are pretty imprecise, offering large prediction intervals that are not very informative for the outcome of the 2024 election. Given how they all offer predictions around 50 percentage points, our 2024 predictions do not seem hugely sensitive to how we measure the economy — they are all similarly imprecise. For that reason, we can assume that the economic model of voting behavior, while helpful in identifying overall trends, requires additional information about polls and other political conditions to offer the sort of precision necessary to accurately forecast elections.
Citations:
Achen, C. H., & Bartels, L. M. (2016). Democracy for realists: why elections do not produce responsive government. Princeton University Press.
Data Sources:
Data are from the US presidential election popular vote results from 1948-2020, the Bureau of Economic Analysis, and the Federal Reserve Bank of St. Louis.